



Built for Fast, Practical Review
After a run, time matters. PigView Analytics is designed to reduce the gap between data collection and understanding what the data actually means.
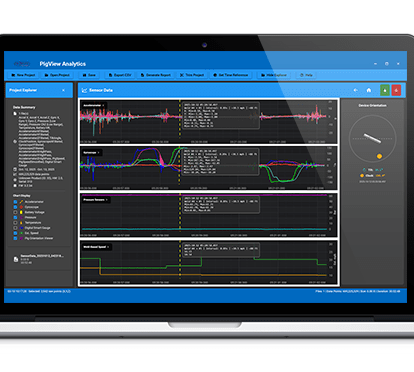
The software presents information in a clear, structured layout that allows users to move quickly from raw measurements to meaningful insight. Instead of sorting through spreadsheets or disconnected files, integrity teams can focus on identifying trends, confirming results, and understanding what happened inside the pipeline.
From Individual Runs to Long-Term Insight
PigView Analytics supports more than one-off review. Data can be exported to standard formats for reporting, archiving, and trend analysis across multiple runs.
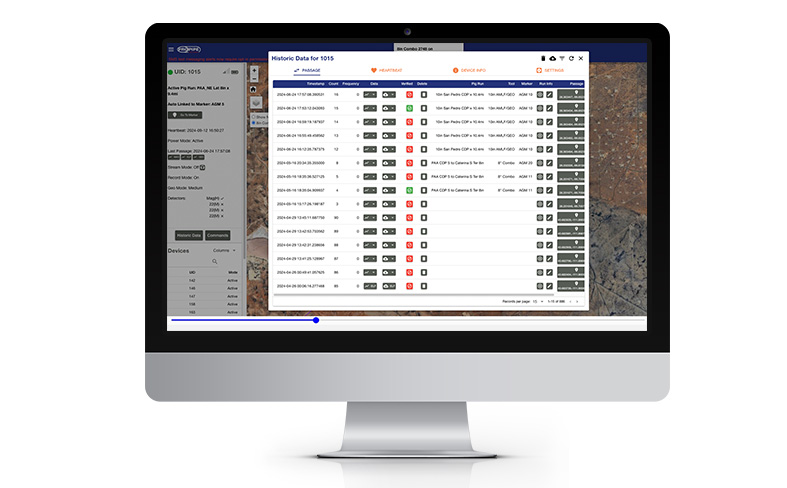
By comparing historical data over time, integrity teams can move beyond isolated results and start building a clearer picture of pipeline behavior. This supports planning, compliance documentation, and long-term integrity programs that rely on consistent, repeatable data.
A Key Part of the PigView Workflow
PigView Analytics is designed to fit cleanly into the broader PigView ecosystem. Data is collected in the field using Propipe AGMs and intelligent transmitters. Configuration and field interaction are handled through PigView Mobile and PigView Desktop. Once runs are complete, PigView Analytics provides the tools needed to review results and extract insight.
Built for Fast, Practical Review
After a run, time matters. PigView Analytics is designed to reduce the gap between data collection and understanding what the data actually means.
The software presents information in a clear, structured layout that allows users to move quickly from raw measurements to meaningful insight. Instead of sorting through spreadsheets or disconnected files, integrity teams can focus on identifying trends, confirming results, and understanding what happened inside the pipeline.
From Individual Runs to Long-Term Insight
PigView Analytics supports more than one-off review. Data can be exported to standard formats for reporting, archiving, and trend analysis across multiple runs.
By comparing historical data over time, integrity teams can move beyond isolated results and start building a clearer picture of pipeline behavior. This supports planning, compliance documentation, and long-term integrity programs that rely on consistent, repeatable data.
A Key Part of the PigView Workflow
PigView Analytics is designed to fit cleanly into the broader PigView ecosystem. Data is collected in the field using Propipe AGMs and intelligent transmitters. Configuration and field interaction are handled through PigView Mobile and PigView Desktop. Once runs are complete, PigView Analytics provides the tools needed to review results and extract insight.